3D Graphs Illustrator tutorial

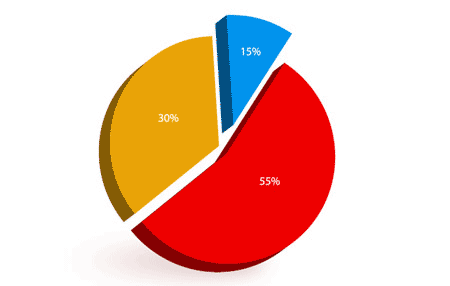
3D Graphs or ‘Three dimensional Graphs’ used as an advanced version of 2D Graphs. 3D Graphs can be used in presentations, reports this makes it attractive than normal 2D Graphs. CS2 Illustrator tutorial will teach you how to create 3D Graphs very easily. Here are the steps for creating 3D Graphs
1. For creating a Graph, Pie Graph Tool has to be selected. A window will appear, give values 200×200px on to corresponding areas.

After entering the values click OK, a table will appear on the screen, which is called Graph data table. Give values 15, 55, and 30 to appropriate places in the table and click the check mark button to apply data. Table will be created like one appeared below.

2. Next procedure is ungrouping or breaking the graph. Why we doing this for to give color, effects on each piece. Go to Object > Ungroup or press Ctrl+Shift+G, Graphs need to be selected before doing this procedure. If done, a warning box will appear on the screen written like this –“After a graph is ungrouped you will no longer be able to access its graph style, its data or change its graph designs”. Do click the OK button and you can start the ungrouping function again. There are 2 ungrouping functions you need to perform, one is for breaking the graph and other is for breaking the object into pieces. Now you can fill with any color you want and remove the stroke color in it.

3. Next procedure is applying EXTRUDE & BEVEL function by selecting any one piece from the Graphs. Then, go to Effect > 3D > Extrude & Bevel.

There are some options in EXTRUDE & BEVEL functions for giving 3D effects like more options if the lower portion doesn’t appear on the screen. Click more options button, now dragging the cube on to left side would lead to specify the rotation of cube or you can enter the values manually to X-Y-Z axis. Then, enter 20pt on to Extrude Depth and then click on to New Light icon to add an extra light and drag it as shown in the figure below.

4. Next procedure is make a graphic style, first select any one piece from graphic styles palette for applying Graphic style for the object, then click on to New Graphic Style icon. Window>graphic styles or Shift+F5 button are used if the Graphic styles palette does not appear automatically.

5. Next procedure is applying Graphic styles, if you have already created graphic styles before. Here, you need to select the remaining pieces and click on to previously selected Graphic style icon. Now the remaining objects will also become effective with graphic styles.

6. That’s it. You have just created a colorful 3D Graph but one last thing you need to do is reposting the pie. Pie would off a bit after you applied the Graphic styles, so for to avoid that use the Selection Tool and put them back together.

Stuff
- » Home
- » About us
- » Portfolios
- » Tutorials
- » Testimonials
- » Contact
- » T&C
- » Sitemap


